
Current Ratio: A Misunderstood Liquidity Analysis Metric
Current Ratio: A Misunderstood Liquidity Analysis Metric
The current ratio is one of the most fundamental of analysis metrics available to any analyst. It is taught to us from the very beginning. We learn it in school. We learn at work. And, yet it seems to me as thought so many analysts ignore it or misunderstand it. Let’s begin by going over, for the novice analyst, what this ratio is and what it tells us.
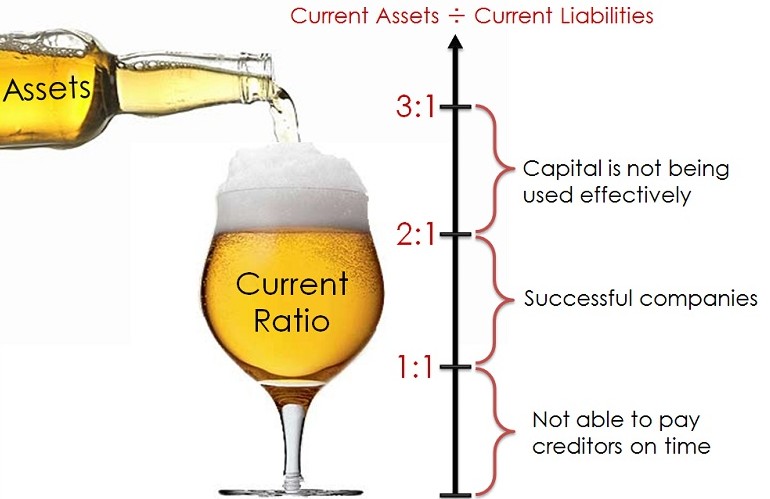
When looking at a company’s financial statements, in particular the balance sheet, you can see that most firms outline which part of their assets and liabilities are current. This means, which assets can very easily converted into cash and which liabilities are due to be paid in the short term. We can subtract the current liabilities from the current assets to see if the firm can easily cover their short-term debts. If the number is positive, then of course, the firm is able to do this. This conclusion can also be represented as a ratio; by dividing the current assets by the current liabilities we obtain the current ratio – a liquidity ratio. This ratio can speak a lot about the efficiency of a company’s operating cycle.
Typically the rule of thumb is to look for a current ratio that is higher than 1, meaning the firm will have no problem paying their short-term debts. This is a great rule to invest by but so many analysts ignore it. They feel that the current ratio has a large amount caveats associated with it, and more so than not, when analyzing a good investment, they assume that another analyst has already filtered through this metric. The prudent solution is not to ignore this, but instead, to fully understand this ratio and, ipso facto, understand the company a little deeper.
It is important to note that often companies with a durable competitive advantage will have current ratios less than 1. Why is this? Well, some strong firms don’t need to hold very many current assets on hand to cover their liabilities because they have incredibly strong earnings power. They can make a lot of money fairly easily through their regular operations. And so, if the liabilities are called upon to be paid, the firm can easily use operating earnings to pay for it instead of holding cash just in case. This earnings potential also gives the company the power to dip into the short-term loan market (STN’s) and borrow easily, if needed, to pay down liabilities. Note that earnings power gives a firm the opportunity to buy back shares that they had issued previously and also pay out dividends; both of these are actions that will deplete a cash balance and therefore reduce the current assets and, therefore, the current ratio. This is important to remember because great companies can be filtered out of an equity screen simply because they have a current ratio less than 1. Keep in mind however, that it’s not only the earnings power that an analyst is looking for, but the consistency of this earnings power as well.
In addition to telling us the liquidity of a company, the current ratio can be used as a comparative metric. We can use it compare across companies and know if maybe our liquidity measure, high or low, is in line with an industry’s norm. But this is dangerous and a prudent analyst has to be aware of the pitfalls. Firstly, there could be various differences in accounting policies between firms. Some firms can value assets and liabilities using historical numbers versus current or average numbers. Some firms treat depreciation differently. And some firms may even get into some creative accounting in order to manipulate their results. Secondly, a comparative company may have simple glitches in the information that they use to calculate their ratios; information may be outdated and old, estimation of costs may be done in a way that isn’t appropriate for the firm (e.g. the use of historical costs), and some information may be an amalgamation and summary of data that simply doesn’t apply to current assets or liabilities. It goes without saying that some firms cannot be accurately compared with others as a result of inherent differences in their business. They are different business, face different risks, can be of different sizes with different capital structures (debt vs. equity) and even have various regulatory influences.

Current Ratio: A Misunderstood Liquidity Analysis Metric
A common preference is to use the current ratio as an internal metric and look at it within the confines of the firm itself rather than against external sources. But even internally an analyst has to be careful. The current ratio is not one that can be compared against itself over a times series. Different time periods vary in technological change, inflation and purchasing power, and even seasonality can play a role. So how can we use the current ratio? Lets talk about taking a current ratio and adjusting it for its intrinsic pitfalls.
As described earlier, the current ratio is given by the current assets divided by the current liabilities. The numerator contains some terms that may not necessarily be as liquid as we think. A firm can have a lot of their assets tied up in inventory, which according to the ratio is liquid, but may actually not be. Some analysts remove the inventory number from the numerator and obtain something called the “quick ratio”. Furthermore, analysts do not always appreciate the accounts receivable (AR) number in the numerator because they are unsure of how easy it is to convert the receivables to cash. These analysts remove this number and, now without inventory or AR, they’re left with the “cash ratio”. This is a very conservative measurement but also very inaccurate because it has been so heavily adjusted. But we can, in fact, adjust the current ratio with minimally affecting the accuracy.
In order to assess the liquidity of the inventory in the current ratio we use the inventory turn over ratio. This is a measure of how many times in one year the basket of inventory that a firm holds gets turned over. The higher this number is, the better, because it means that the inventory gets replaced more often during the year. The same methodology can be applied to the AR turnover ratio. A higher number indicates more frequency of AR being turned over to cash. However, here we have to be careful. Because we are assessing the liquidity of each component of the current ratio we have to remember that some components have two sides. The other side of the AR number is accounts payable (AP). This is how much money is owed and payable within the short term. Previously we just netted the two numbers in the ratio. So here we have to take into consideration the AP turnover ratio that is found in the denominator of the current ratio as well. A rising accounts payable turnover ratio indicates DECREASING liquidity. Now lets talk about how this liquidity is measured.
Every time a bill comes due, from the perspective of a payer or a receiver, is called a “rotation”. There are 12 rotations in a year because, obviously, bills are typically due monthly (this can be adjusted). An inventory turnover number represents how many of these rotations in a year the inventory is exchanged. The same applies for AR and AP. You can represent this turnover number as a percentage of the amount of rotations available as well. So an inventory turnover of 3 means a liquidity of 25% (3/12 rotations). Note: The calculation of these ratios is:
- Inventory turnover = cost of goods sold / average inventory
- AR turnover = sales / average AR
- AP turnover = purchases / average AP
This liquidity percentage is a huge benefit for us as analysts. We can now multiply the liquidity percentage that we find by its respective number and get the actual portion of, say AR, that is liquid and can be used in the current ratio.
Remember that although the current ratio can be improved in the way described above, it still has to be used carefully and interpreted with a complete understanding of the firm as a whole.


